


Planetary nebulae offer the advantage in spectroscopy of delivering most of their light into a very few wavelengths. As a result spectroscopy of fainter nebula can be observed and/or shorter exposures carried out when compared to the equivalent magnitude star. My particular interests are in identifying the elements-molecules that are "out there" by means of spectroscopy.
The planetary nebula is shown on each presentation along with the slit location-the slice where the composition was determined.
Ring Nebula M27 Saturn Nebula Blue Snowball
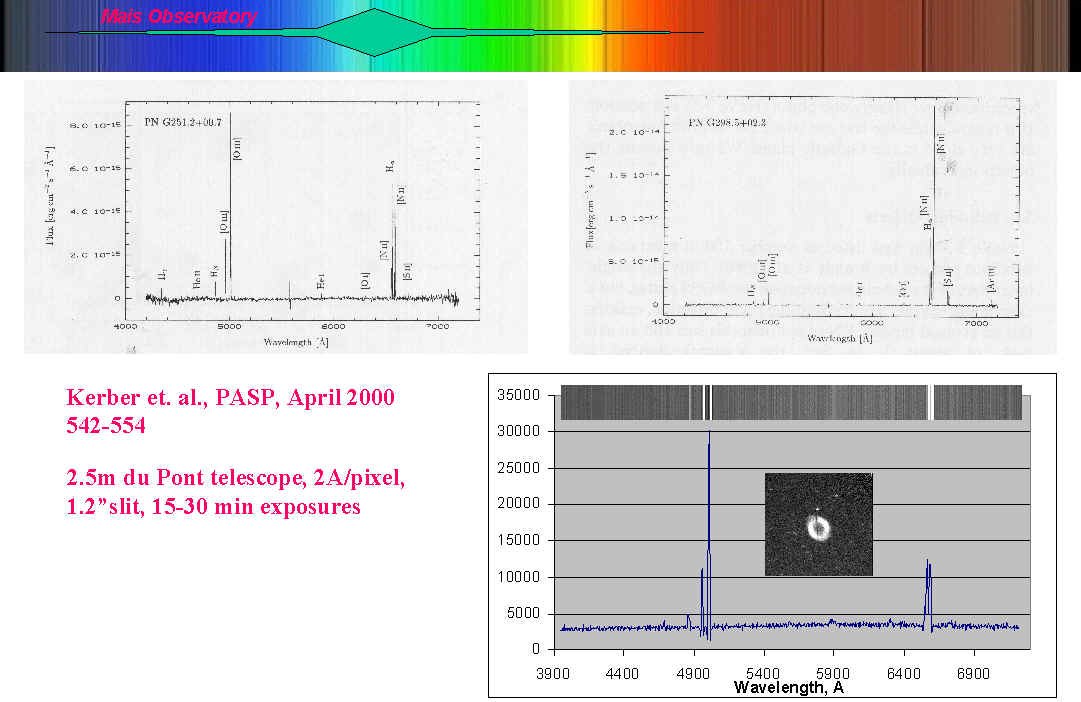
Comparison spectra with those professionally obtained:
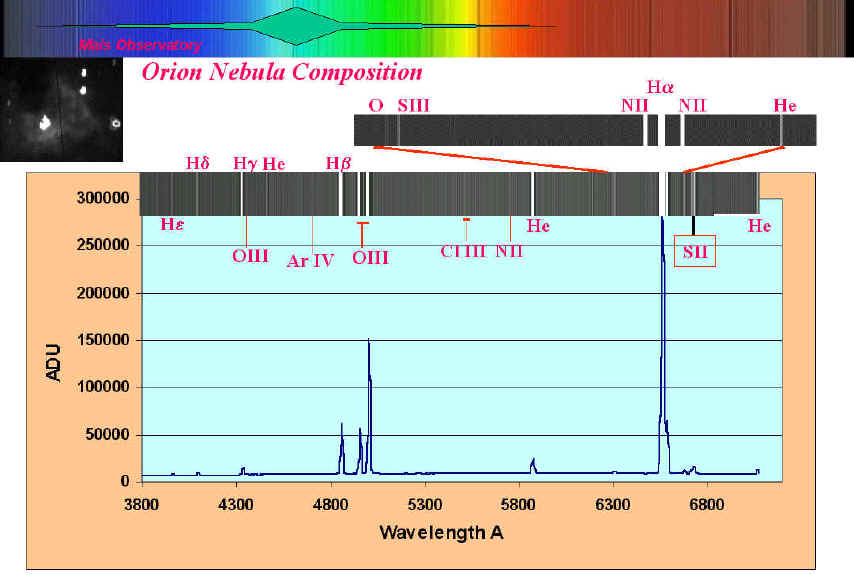
Spectrum of the Orion Nebula in both low and high resolution. The NII and OIII line used to calculate the temperature and electron density of nebulae are indicated on the graph. See below how to calculate these values.
Temperature and Density of Planetary Nebula
Determined from Spectral Characteristics
Equations are derivable, from a theoretical standpoint, which allows one to determine the temperatures and electron densities of planetary nebula. The beauty of these derived expressions is that the transition probabilities fall out and the equations can be combined to eliminate the need to know the electron density Ne. These equations are based upon the line intensity ratios of certain emission lines.
For oxygen, OIII, we have:
(I4959 + I5007)/I4363 = [7.15/(1 + 0.00028Ne/T1/2)]*1014300/T 1.
Transition Diagram for Common Nebular Oxygen Lines
Every excitation to 1S will result in emission of either 4363 or 2321 A photons, the probability depending on their relative transition probabilities. Likewise, every electron in the 1D level will result in 4959 or 5007 emissions. The 4363 line also populates the 1D level, but this route is small compared to direct excitations. Excitations to both levels (1S and 1D) are by collisions with different energies required (2.7 and 5.4 eV) which means that the resulting relative populations depend upon the energies of the atoms-ions and hence upon kinetic temperature.
A very similar diagram can be made for nitrogen (NII)
For nitrogen, NII, we have:
(I6548 + I6584)/I5755 = [8.5/(1 + 0.0029Ne/T1/2)]*1010800/T 2.If a spectrum is obtained in a small area of the nebula, equations 1 and 2 can be combined and electron density eliminated to yield:
[(I6548 + I6584)/I5755]*7.15*1014300/T – 0.82*[(I4959 + I5007)/I4363]*1010800/T = 0.9*[(I6548 + I6584)/I5755]*[(I4959 + I5007)/I4363]
3.
The line intensity ratios are easily obtained from the spectrum and can be corrected for quantum efficiency of the CCD chip for the particular wavelength.
For example: for The Blue Snowball, NGC7662, (I6548 + I6584)/I5755 = 45
and (I4959 + I5007)/I4363 = 152 as determined from the spectrum.
Notice that equation 3 cannot be solved explicitly for T but T can be solved in an iterative process. When this is done, one obtains a temperature, T of 11000o K. This value is within 10% of the literature value.
Taking this temperature, one can determine the electron density Ne by plugging into equation 1 or 2 the temperature. When this is carried out one obtains Ne =
~30000 electrons/cm3. Again, the value in the astronomy literature is ~32000 electrons/cm3.More Planetaries
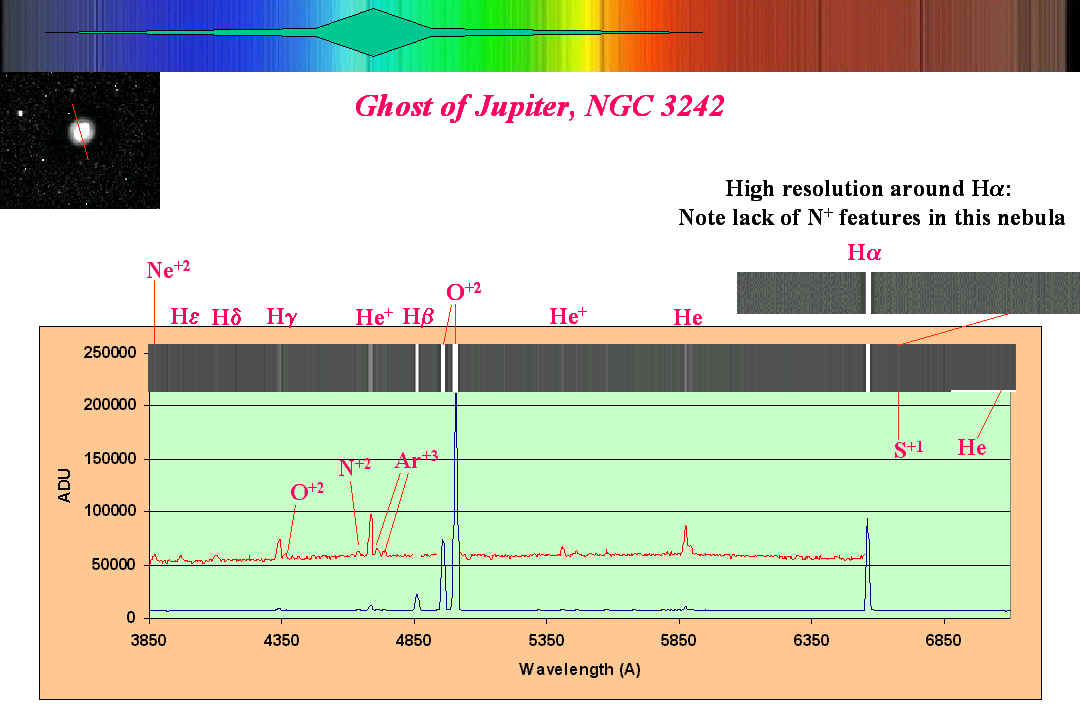 Ghost of Jupiter, NGC 3242
 Not all Planetaries are created equal as is illustrated here. Note that The
Saturn Nebula possesses strong Nitrogen +1 line around the Hydrogen
alpha line while The Ghost of Jupiter has undetectable lines.
Not all Planetaries are created equal as is illustrated here. Note that The
Saturn Nebula possesses strong Nitrogen +1 line around the Hydrogen
alpha line while The Ghost of Jupiter has undetectable lines.
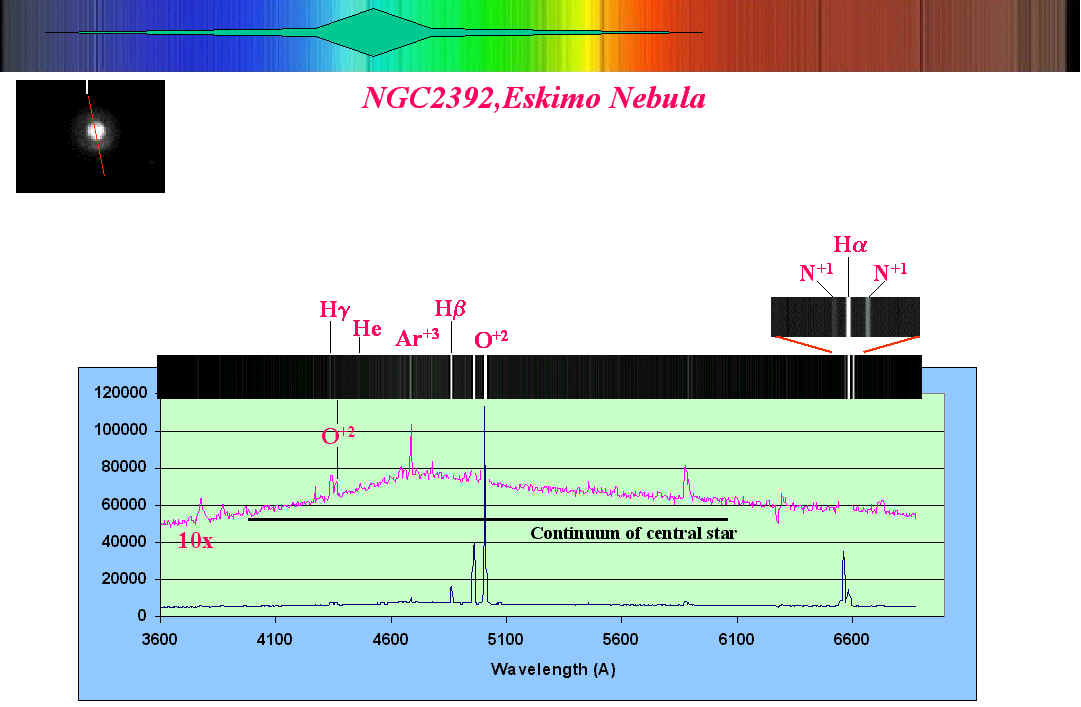 Eskimo Nebula, NGC 2392. What is interesting in this spectrum is that the
planetary PLUS the central stars spectrum was originally picked up across the
slit. This is seen clearly in the 10x magnified portion of the graph where the
continuum of the hot central star is labeled. The original spectrum obtained is
a spectrum across the slit so data is present for the planetary across the slit
which both includes and excludes the central star.
Eskimo Nebula, NGC 2392. What is interesting in this spectrum is that the
planetary PLUS the central stars spectrum was originally picked up across the
slit. This is seen clearly in the 10x magnified portion of the graph where the
continuum of the hot central star is labeled. The original spectrum obtained is
a spectrum across the slit so data is present for the planetary across the slit
which both includes and excludes the central star.
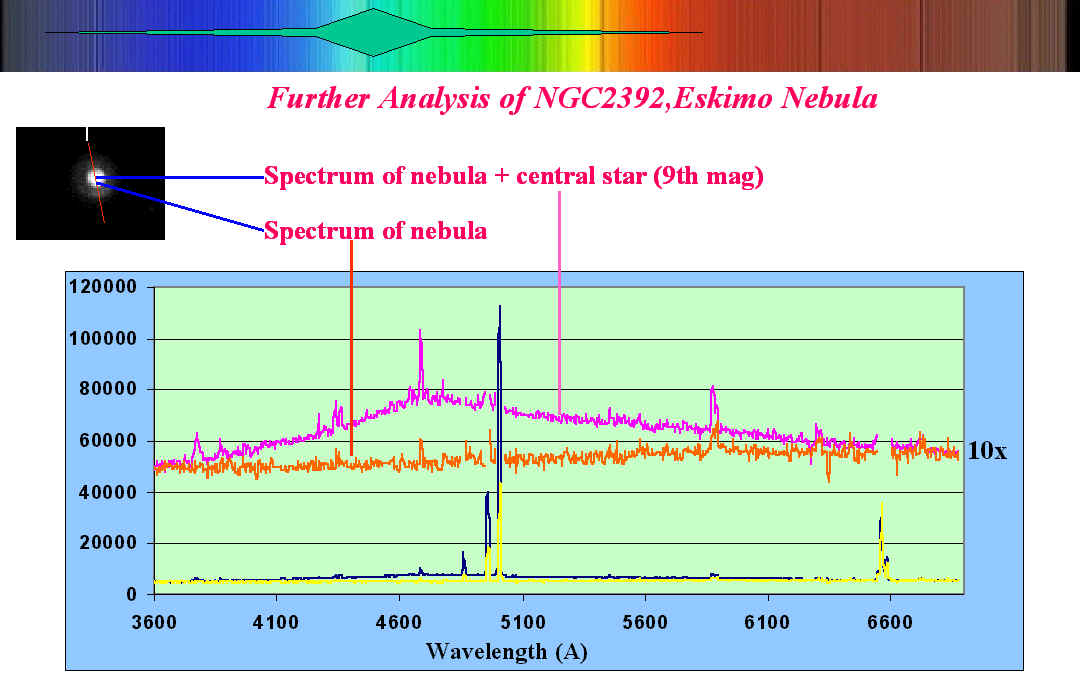 This figure shows the result of further analysis of the original data where
the spectrum was analyzed along the slit excluding the central star.
This figure shows the result of further analysis of the original data where
the spectrum was analyzed along the slit excluding the central star.